3. Analyze Your Data
Instant Data Availability
Key Benefits:
- Instant Statistical Analysis.
Crash data is available instantly within the system. No lag time or delay in waiting for data from the state archives.
- Location-based statistics.
ReportBeam includes a powerful mapping engine for displaying all crashes, allowing you to quickly view a community-based map showing hotspots and other collision statistics. - Limitless reporting functionality.
ReportBeam provides an almost limitless number of report variations to be created through the use of filters. These filters allow you to drill-down quickly and easily to review any crash data statistic you would like to (or have been asked to).
- Customizable and Extensible reporting.
In the event that a specific report is not available within the system, additional reports can be added quickly.
Key Features:
- Powerful crash analysis tool
- Geographical mapping of crash locations
- Create hot-spot zones to analyze a critical area or corridor instead of a specific location or intersection
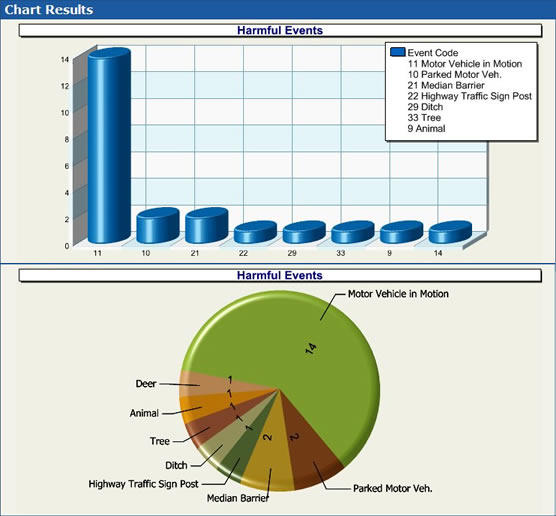
- Built-in reporting system including charting
- Customizable reporting based on advanced options. Filter data based on time of day, age of involved parties, weather conditions etc.
Mapping Services
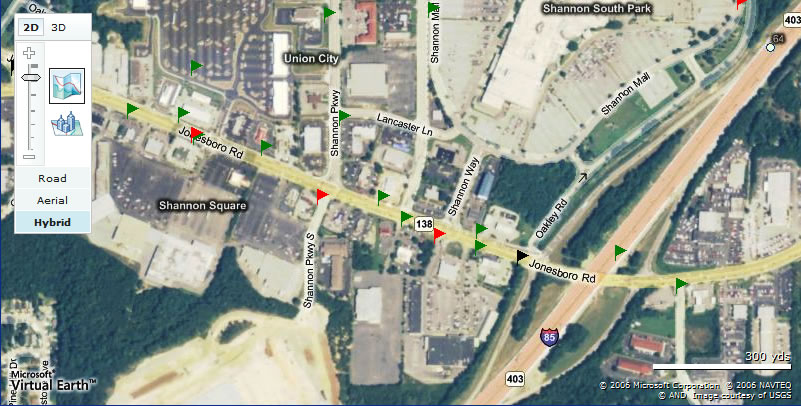
A built-in mapping engine is provided with the standard ReportBeam system. In addition, ReportBeam can be integrated with city engineering map data.
ReportBeam provides the ability to view incidents instantly on a map, supplying a quick graphical view of where the trouble areas are.
ReportBeam provides police or city managers with a wide range of reports, including an instant map view of the community showing collision locations over any time period. This allows supervisors and decision makers to quickly establish causes of incidents.
Creating Safer Communities
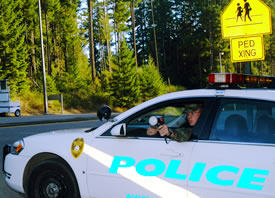 Police or city managers with access can request a variety of reports, including an instant map or satellite view of a community showing collision locations over any range of time. ReportBeam compiles statistical information flagging areas of high incidents in a community from school zones to shopping areas.
Reduction of time-consuming paperwork allows human resources to be allocated to more important tasks.
Find out where, why and more...
Timely access to data saves lives!
ReportBeam puts you in control, simply choose the time frame and factors. Supervisors and chiefs have instant access to reports and map views showing crash locations, statistical trends, and officer activity. ReportBeam features a powerful, location-based analysis system to allow Supervisors and decision makers to quickly drill down to locate high-incident intersections or other hot spots within their community.
Statistical Analysis
 The various reports (including general statistics) within ReportBeam provide the basis of creating focused, usable information for proactive policing. A report can show an increase in alcohol-related incidents between 2am and 4am at an intersection near a pub or bar. This information may lead to stepping up patrols during late night hours to stop offenders and save lives.
Step 4:
Online Distribution